
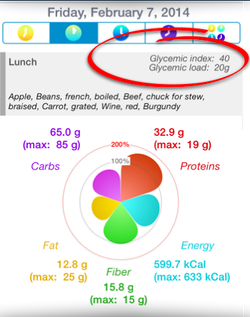
The "flower"
|
The flower is showing the nutrition facts for all your meals, and for the entire day. The surface of a petal is proportional to carbs, proteins, fat, fibers and energy. A fine grey circle shows the recommended size (the ideal value is also given, e.g., here "max = 85g" for carbs). The average Glycemic Index is also provided (see red circle). The glycemic load, which represents the amount of carbs that will increase the blood glucose level, is also proposed.
|
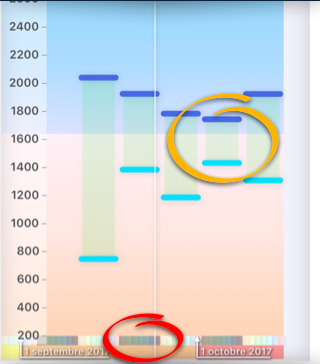
The "balance"
|
When the tab "kCal/week" is selected, this graph shows the average calories intakes (cyan) and energy expenditure (marine blue) for 7 days.
The difference between your calories in and out are depicted by a downward green arrow when you're burning energy and red upward when you're storing energy. The background is in two parts, with a grey (bottom) part representing your resting metabolism, and the upper (blue) part the energy available for your activities. It better to avoid taking less than your basal metabolism or, in other word, the cyan rectangle should always be in the blue upper part. |
